
What Volatility Really Means
A look at how the market measures volatility, why it spiked and then collapsed this year, and what the number is really counting underneath.

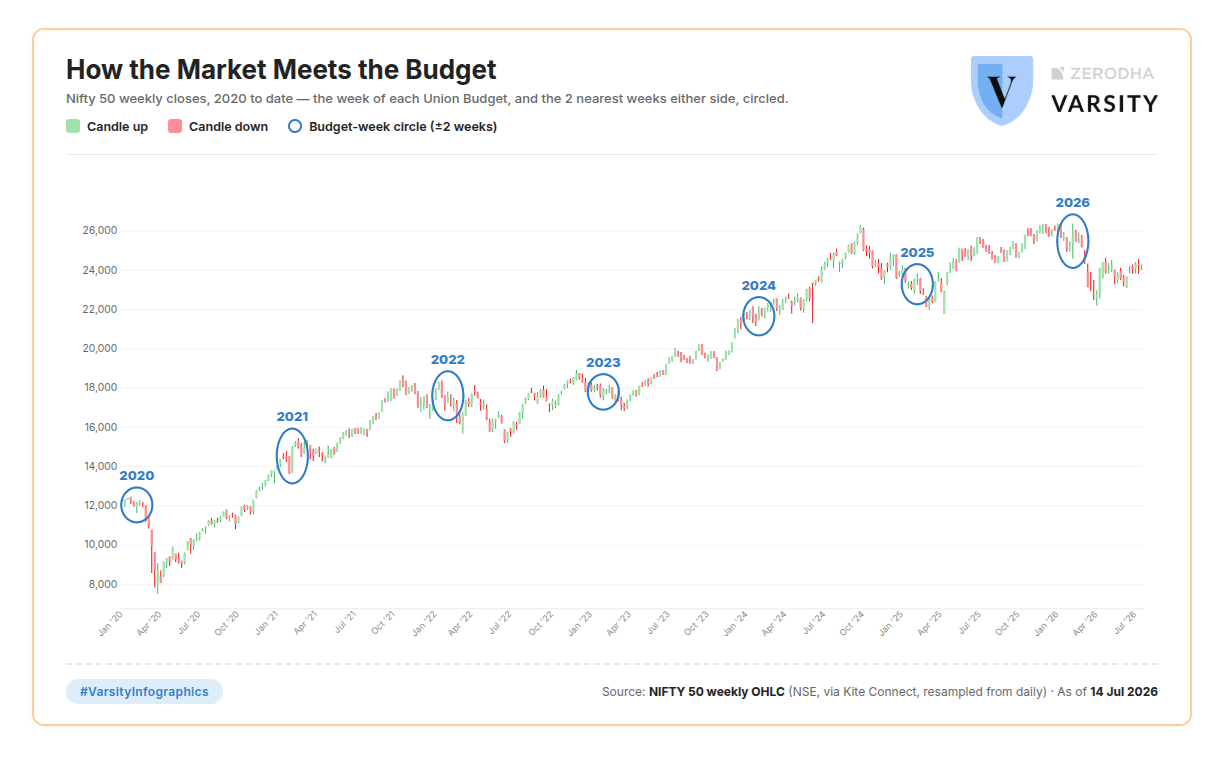
Let’s go back to February 1, 2021. The finance minister has just finished reading the budget, and the market jumps: the Nifty vaults from 13,634 to 14,281, up 4.7% in a single session, its strongest budget-day reaction in at least a decade.
There was a time when it took a real event to move the market. A central bank would change interest rates, or a finance minister would rise to read the budget, and prices would react. Those moments were scheduled, occasional, and mostly polite.
Lately, the market has changed. A single post from the head of one country, an offhand remark from the leader of another, a flare-up at a border, or even the rumour of a new virus can send prices swinging before the morning coffee has cooled.
But the real damage is rarely the price swing itself. It is what the swing does to us.
Imagine you invested in an index fund in January. By March, your portfolio is down 10%. Yet almost nothing about the companies you own has changed. What has changed is everything around them. Your screen is red. The headlines are grim. Selling suddenly feels like the sensible thing to do.
That is the pattern worth noticing. Markets do not become difficult simply because prices fall. They become difficult because fear rises, making temporary uncertainty feel like permanent damage.
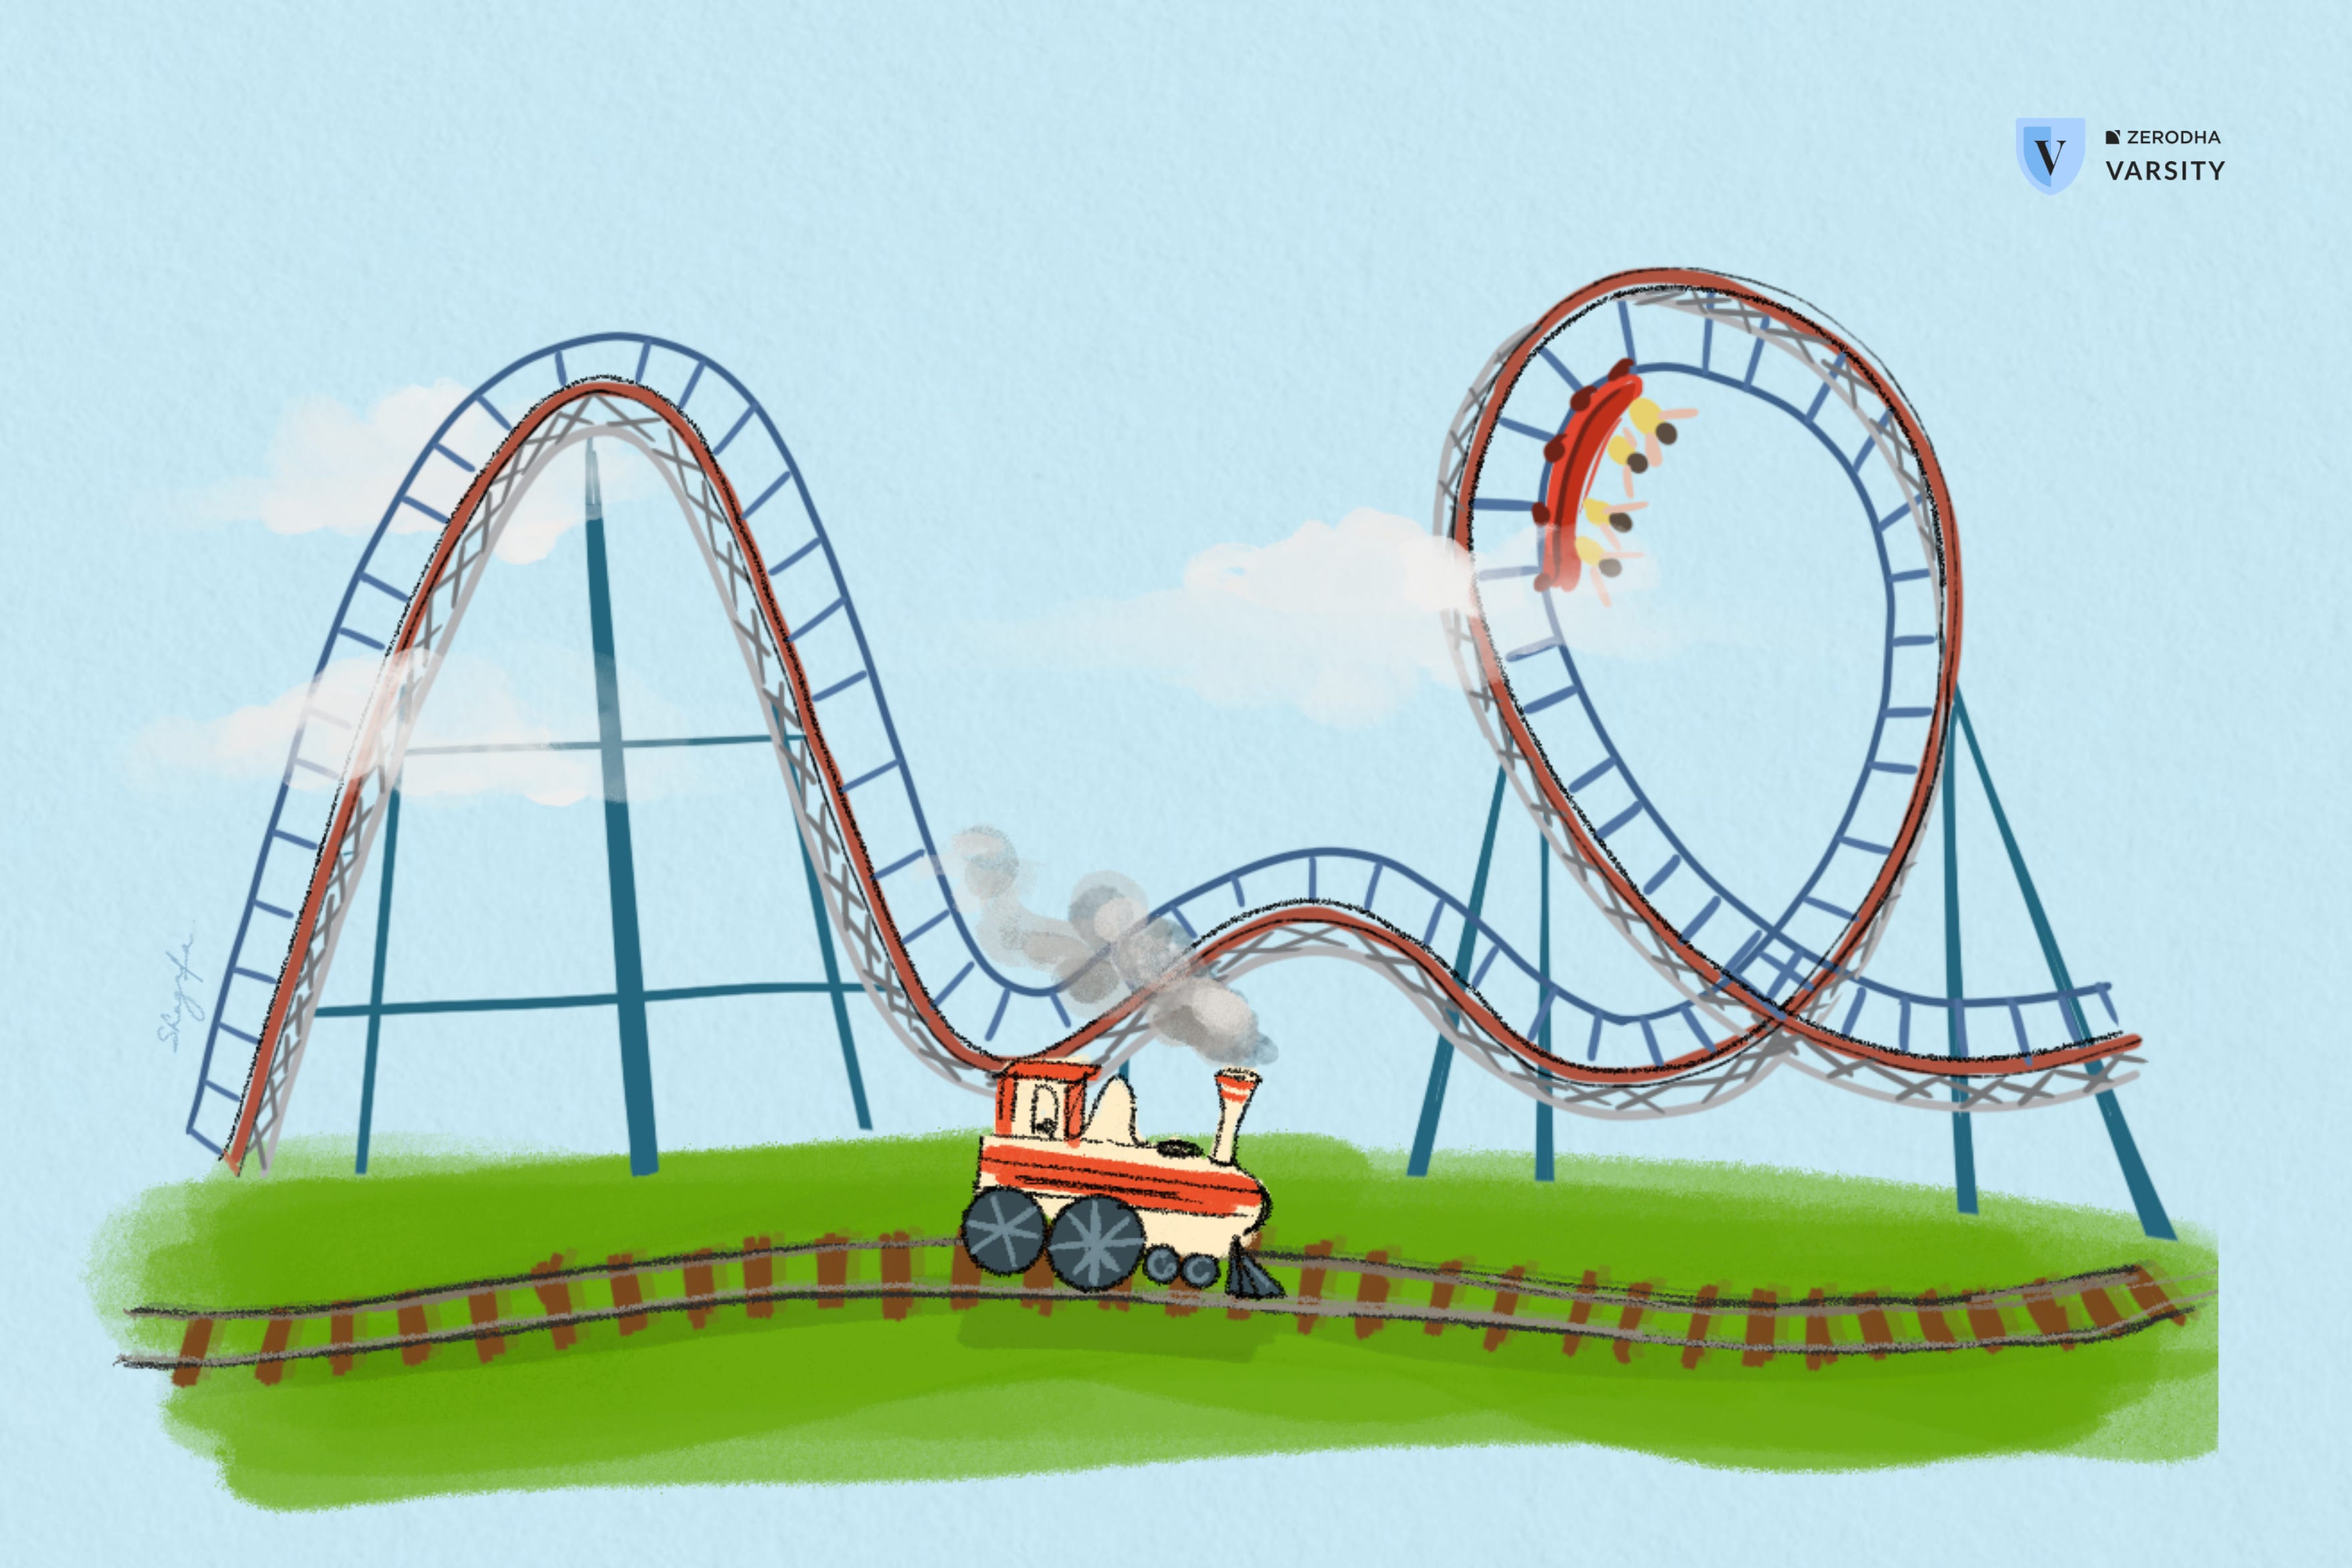
All that swinging has a name: volatility. Better still, it can be measured. In India, that measure is India VIX. It rises when the market expects bigger moves and falls when calmer days are expected. In practice, it is also one of the best gauges of how nervous the market has become.
This week we’ll take volatility apart: what it is, where it shows up, the two forms it takes, and how investors and traders each read it. One idea ties it all together. Prices move every day. Emotions don’t. But when emotions do move, they leave their fingerprints all over volatility.
A number with a shape
Start with India VIX itself, across 2026.
It began the year quiet, drifting near 10, the kind of low reading that shows up when nobody expects much to happen. Then late February brought conflict in West Asia, and the line went almost vertical. By March 30 it reached nearly 29, its highest in a year. The market was braced for large daily swings, and it got them.
Then the long descent. A peace agreement signed on June 17 drained the last of the fear out, and by early July India VIX was back under 12, down close to 60% from the March peak.
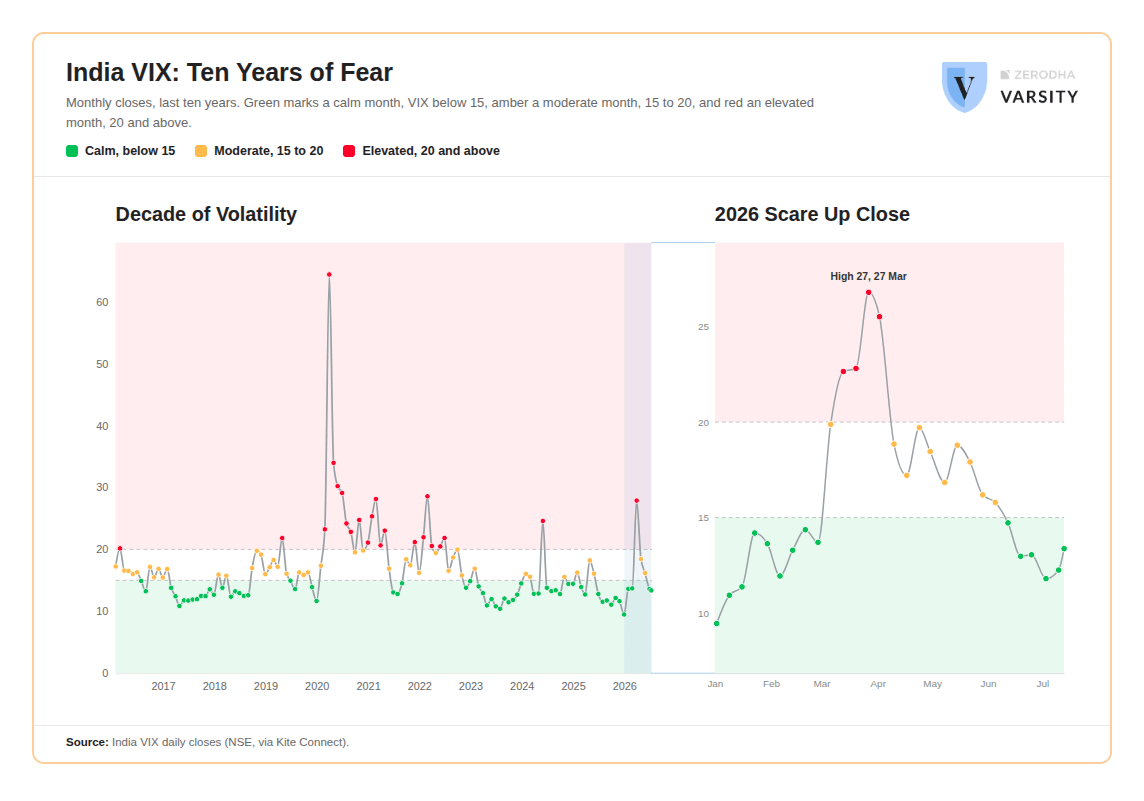
That whole arc, the near-vertical climb and the slow bleed back, is fear arriving and then leaving. And here is what the “volatility is gone” story leaves out. Today’s reading is low compared with March. Compared with January, it is still higher. The number fell a long way, but it has not gone back to sleep.
Why the number jumps when the market falls
Volatility measures how much a price moves, not which way it moves. Picture two paths for the Nifty, both starting and ending at the same level. One drifts there gently. The other arrives through a series of sharp swings. They finish at the exact same price, but one was volatile and the other was not. Same destination, very different ride. Volatility is the width of that second path: it says nothing about where you end up, only how bumpy the trip was. When India VIX is high, the market is expecting a wide path. When it is low, a narrow one.
By definition, then, volatility is blind to direction. In real markets, direction and volatility are joined at the hip. Take 2026 a fortnight at a time and set each move in the Nifty beside the move in India VIX. Where the index is red, the fear reading turns green, and where the index rises, the fear reading fades. They run as opposites, panel after panel.
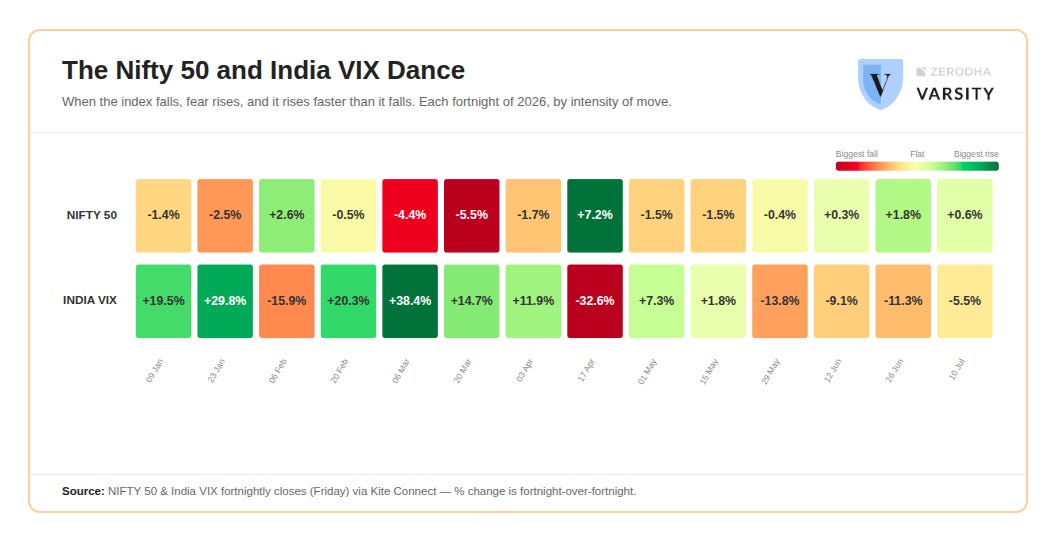
But look closer and the mirror is lopsided. In early March the Nifty fell 4.4% and India VIX jumped 38%. In mid-April the Nifty rose a larger 7.2%, and VIX fell just 33%. A bigger move up drew a smaller response than a smaller move down. This is why VIX is called the fear index and not the movement index. In theory it measures movement in both directions. In practice it leans one way, because we do. We do not weigh gains and losses evenly: a fall of a given size frightens us more than a rise of the same size reassures us. Volatility inherits that lopsidedness, growing loudest on the way down, because that is where the fear lives.
The whole world got scared at once
India’s reading did not spike alone.
Take India VIX, America’s VIX, and Japanese and Australian equivalents, set each to the same starting point so their shapes can be compared, and lay them on top of one another. The striking thing is how little of the story belongs to India. The same late-February jump, the same spring peak, the same summer fade appear on every line.
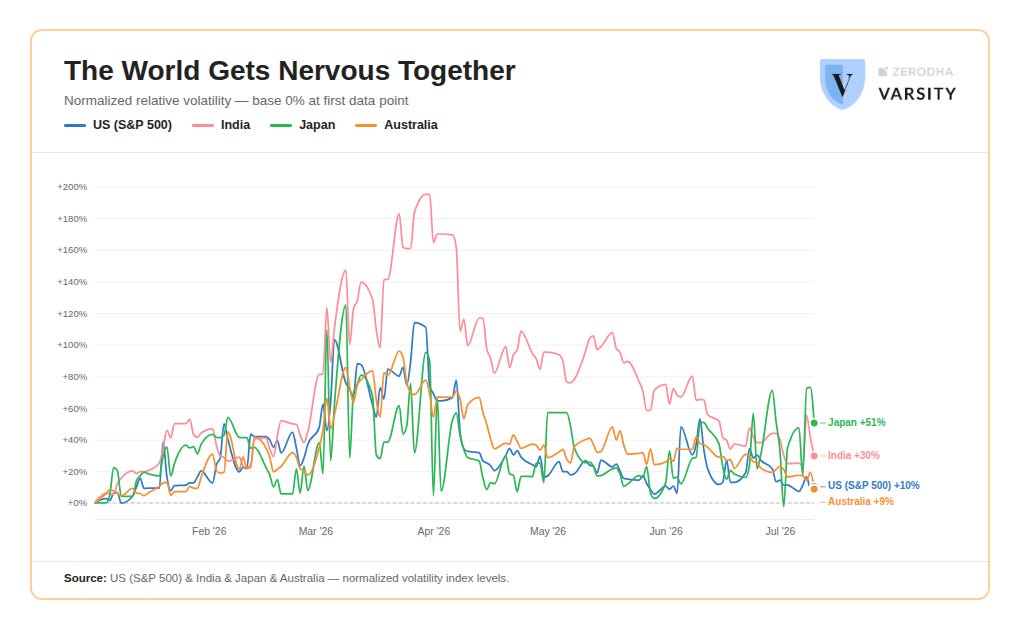
There are differences in height. India ran hotter at the peak, and by early July America’s reading sat higher than ours. But the shape is shared. Volatility is usually a mood the whole world is in, not a local event. A calm Indian market is generally a calm world, and a frightened one rarely panics by itself.
Smaller company, wilder weather
That shared mood is still one number laid over everything. Zoom back into India and volatility is not a single climate but several, and they turn wilder the further down the market you travel.
Sort the market into its broad size tiers and the pattern is orderly. Among the Nifty 50, the largest and most heavily traded companies, the typical stock’s realized volatility sits near 22%. Step down to the Nifty Next 50 and the middle rises to 28%. The midcaps sit near 30%. The smallcaps near 34%, and their tail runs far higher, with individual names moving at two or three times the pace of a steady large-cap.
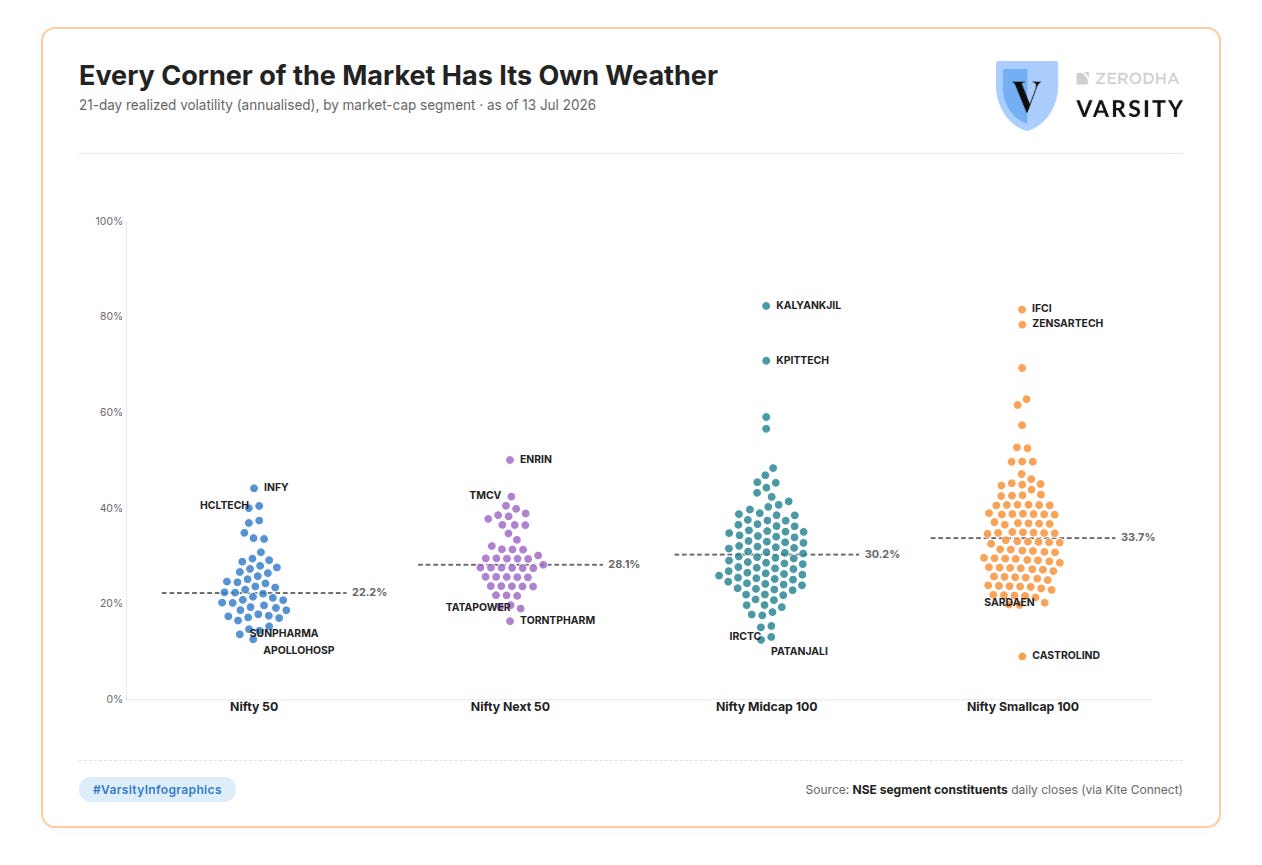
The reason is familiar even if the numbers are not. The big names carry the weight of index funds, steady institutional ownership and constant coverage, all of which smooth their path. The smaller a company, the thinner its trading and the larger any single piece of news looms, so its price lurches where a large-cap would drift, and the wildest readings of all tend to belong to whichever small name is caught up in a story of its own. The one volatility figure on the ticker is really a large-cap figure. It describes the calm top of the market well and the restless floor beneath it hardly at all.
Two kinds of volatility
We have treated volatility as one thing. It is really two, and the split lines up almost exactly with how investors and traders each look at the market.
Realized volatility is history. It measures how much a price has already moved, worked out straight from past prices. This is the investor’s version of volatility. It is memory, the size of the last scare, and it shapes how risky the market feels right now. When the January investor watched the portfolio fall and felt the urge to sell, that was realized volatility doing its work, backward-looking and felt as fear.
Implied volatility is expectation. It is worked backwards out of option prices, and it reflects how much the market thinks a price will move from here. This is the trader’s version. It looks forward, and the trader is not really asking how risky the market feels. The trader is asking what that expected movement costs.
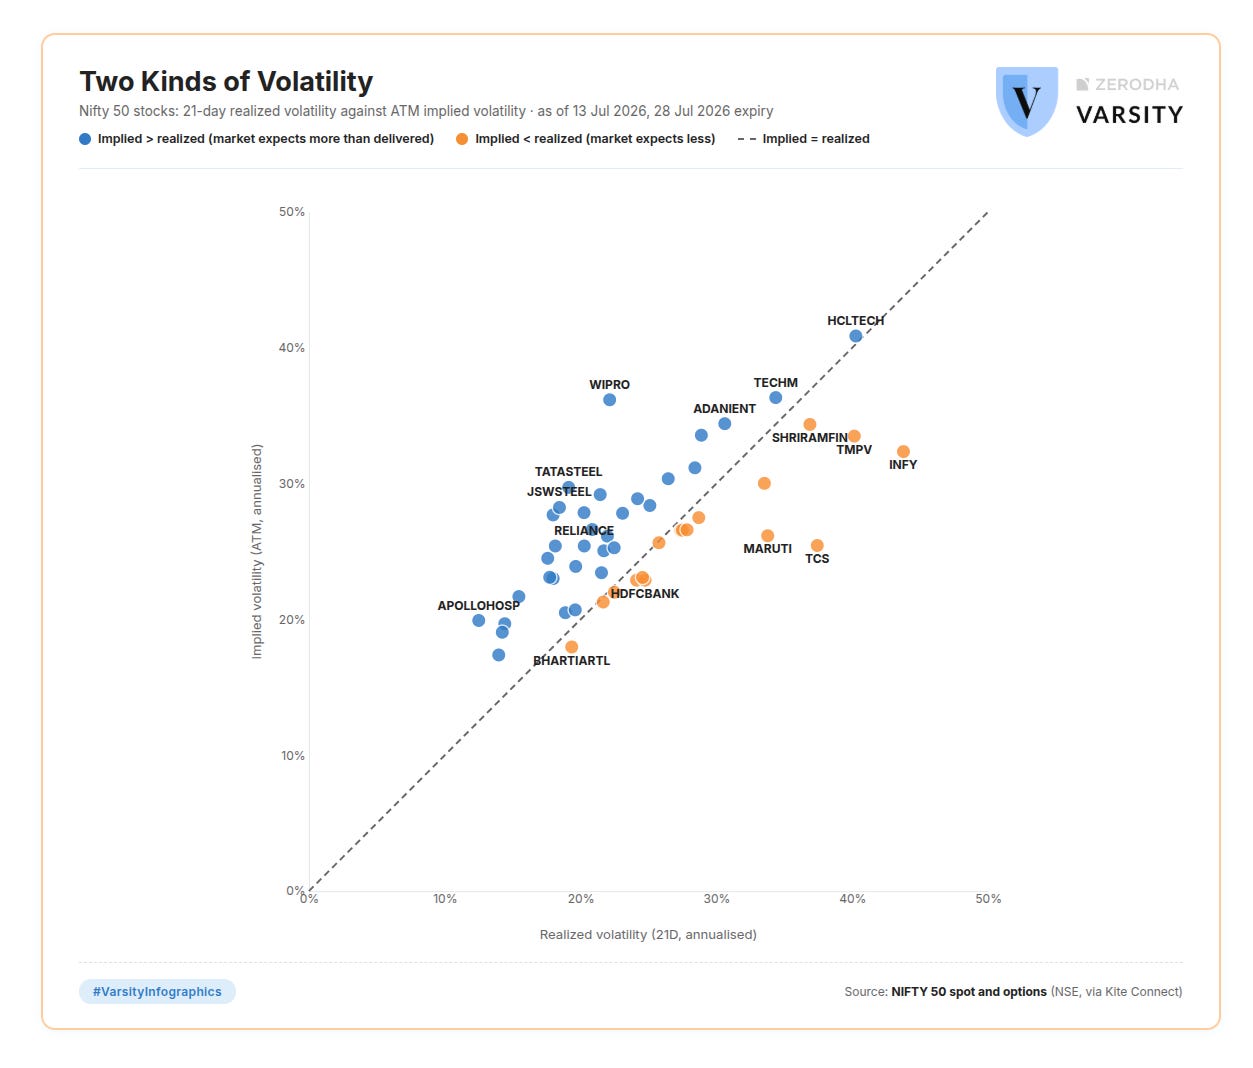
Across the Nifty 50, most dots land above the line, with implied volatility sitting a little higher than realized. That tilt is normal: options tend to carry a small premium for the movement that might still come. The outliers tell the sharper story.
WIPRO sits high above the line, its options bracing for a swing far larger than the stock has actually made, the kind of gap a trader would call expensive. INFY sits at the far corner below it: it has moved more than almost anything else in the index lately, yet its options now expect noticeably less, which makes that expected movement look cheap.
Two IT names, opposite readings. That gap from the line, expected minus actual, is what a trader watches most closely. Same number, two readings: to the investor, how frightening things feel; to the trader, whether that fear is worth paying for.
The Closing Bell
“Volatility is low” is a fair description of the market today. It is also the least interesting thing you can say about volatility.
The number has a shape, and the shape follows real events. It ignores direction, yet rises mostly when prices fall. It moves across the whole world at once. It hides enormous variety between individual stocks. And it comes in two forms, one measured and one expected. The figure on the ticker is only the surface. Almost everything worth knowing about volatility is in what that figure is quietly averaging over.
The next time a drawdown has your attention, remember that volatility is shaping what you see and feel. Sometimes the businesses you own carry no real stress of their own. But markets are wired together, and a shock elsewhere in the world, or one large event, can reach your portfolio anyway.
Traders sit on the other side of the same number. A high VIX cheers options sellers, who see the fat premiums that fear puts on the table. But a high reading is also the market bracing for large moves, and if those moves arrive, the loss can run well past the premium collected. The fear that pays the seller is the same fear that can sink them.
Either way, reading volatility well changes the decision in front of you, and learning to see it stock by stock, rather than as a single number on the ticker, is what turns it from background noise into information.
Calm is not the absence of volatility. It is volatility resting at the quiet end of its own range.
Data: NSE, CBOE, STOXX. Volatility figures are annualised. For market education only, not investment advice.
This newsletter is written by Akshay Navin.
Do read, “Lumpsum vs STP?” in our Second Order newsletter.
For any feedback or topic suggestions, write to us at varsity@zerodha.com

Always learning something new! Very insightful!
Summing up my experience on reading the article: Your English is very good. Same thing written in multiple ways to have an impact on the reader.
All good BUT, you could have touch base as to what extent the vol number impacts option pricing with maybe an example and calculation methodology in a language that layman can comprehend. That would have been a USEFUL information.