

Have you heard of creative destruction?
This year’s Nobel Prize in Economic Sciences was awarded for studying economic growth and how creative destruction propels it.
In simple terms, creative destruction occurs when existing technologies or systems are replaced by new, more efficient market players, replacing incumbent companies.
But you know what I consider another form of creative destruction? This one is quite literal: creatively destroying the definition of something for higher sales.

I’m talking about how banks show interest rates on compounding FDs using a simple interest formula and then call it “yield,” “annualized yield,” or “effective yield.”
Let me explain.
The world of investment runs on compounding.
When you see an equity mutual fund that has delivered a 12% CAGR per annum, it simplifies all the ups and downs of returns into one number.
Year 1 return: 12% on your principal
Year 2 return: 12% on (principal + first year’s returns)
And so on.
It’s a compounded annual rate.
Similarly, debt mutual funds and bonds use CAGR or YTM (Yield to Maturity), which also represent annual compounded returns.
YTM is an indicative number on debt funds that tells you how much you would earn each year on a compounded basis if you hold the investment till maturity.
Now, let’s talk about Fixed Deposits.
Our focus here is cumulative FDs, where your interest is reinvested, and you receive the total (principal + accumulated interest) at maturity.
Most Indian banks show two numbers: the FD rate and the yield.
What’s the difference?
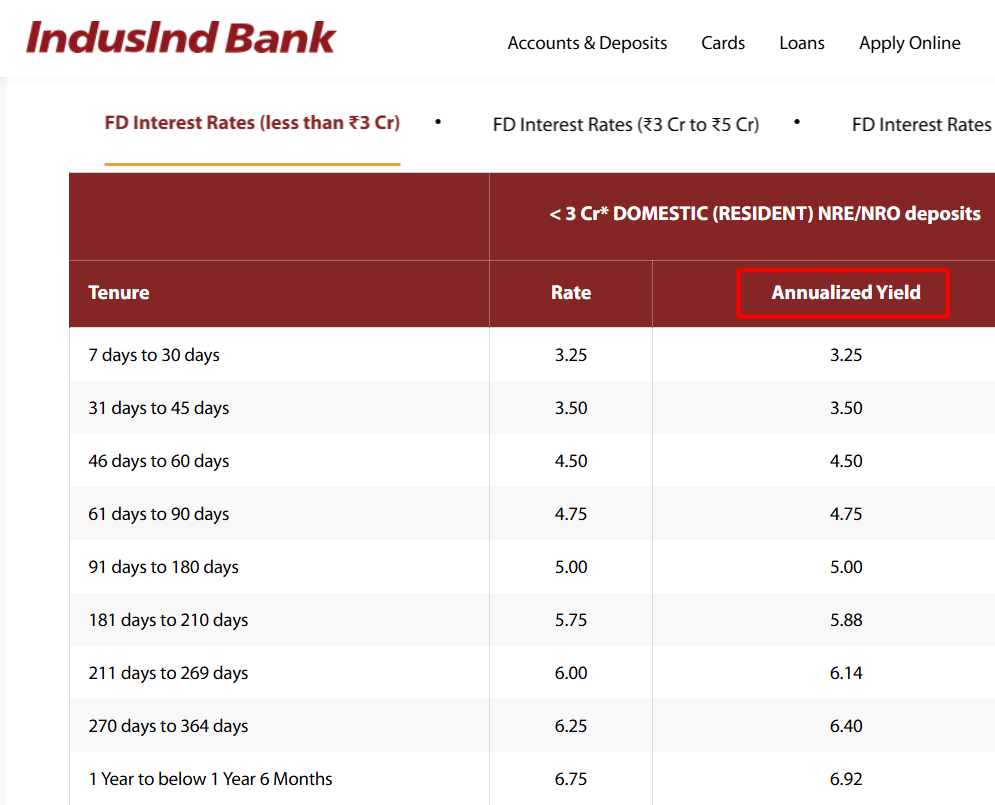
Most Indian banks compound interest quarterly. So, if you invest ₹1 lakh at 6% per annum (rate in the first column), your total interest for the first year isn’t just ₹6,000 (Rs 1lakh*6%). It’s slightly more because of quarterly compounding.
You see, what you effectively earn on an FD annually, just like other investments, isn’t immediately intuitive because of quarterly compounding. And you can’t directly compare these FD rates with CAGR or YTM because the latter assumes annual compounding.
That’s where ‘yield’ comes in: to give you a rate that assumes annual compounding.
In our above example, the yield works out to about 6.14%, representing what you effectively earn in a year.
So far, so good, right? But here comes the twist.
Different banks in India calculate ‘yield’ differently.
Take YES Bank and DCB Bank:
Both offer 7% per annum for a 3-year FD with quarterly compounding. But YES Bank shows an annualized yield of 7.2%, while DCB shows 7.71%.
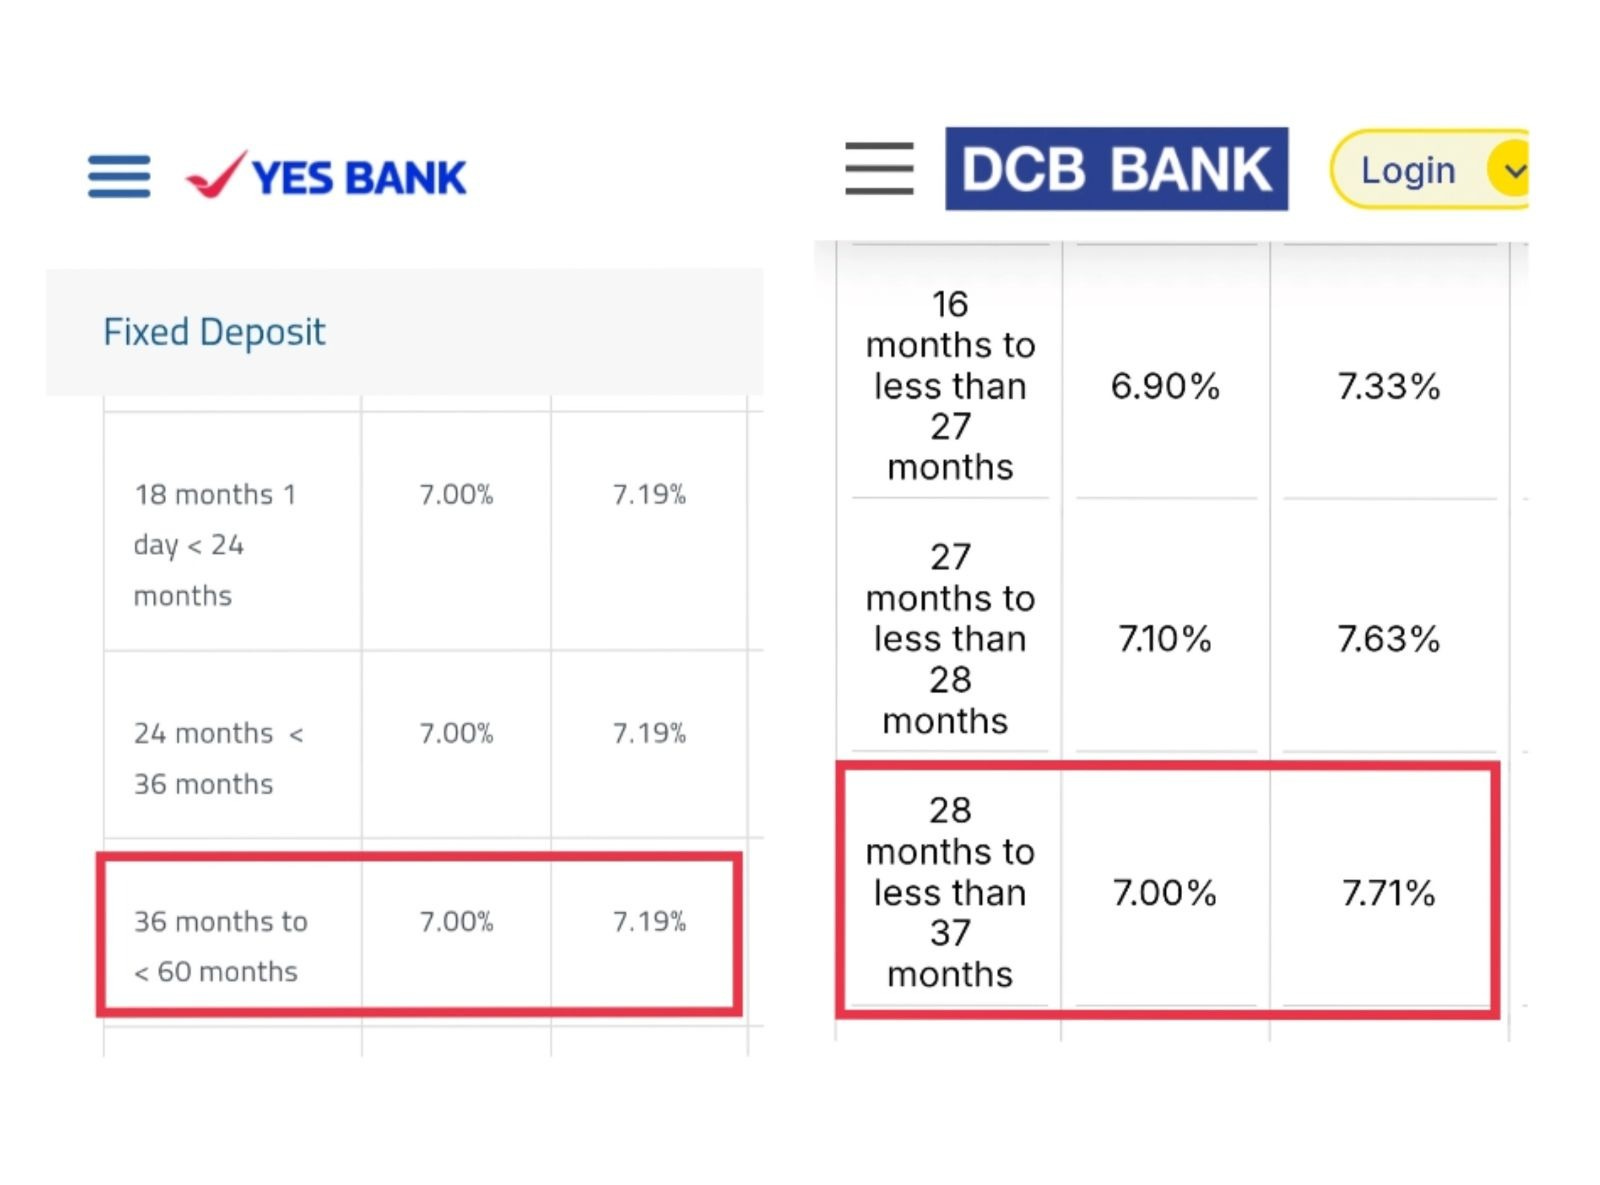
Whose number is right?
If you invest ₹1 lakh in either FD, after 3 years, your maturity amount would be Rs 1.23 lakh.
Use the compound interest formula of A = P*(1+r)^n.
where A = maturity amount,
P = principal invested,
r = interest rate,
and n is the tenure of the FD.
You get an annual compound interest rate of 7.19%
This matched Yes Bank’s yield. But how did DCB arrive at 7.71%?
They simply took the total interest earned over 3 years on the principal (23,000/100000), and divided it by 3 (the tenure). They called this the ‘yield.’ This is nothing but a simple interest formula, where periodic interest receipts are not considered to be reinvested and do not earn any return.
Showing a simple interest rate for an FD that compounds is misleading, to say the least.
Imagine you’re comparing two banks — say Canara Bank and South Indian Bank — and want to choose the one showing the higher “yield.”
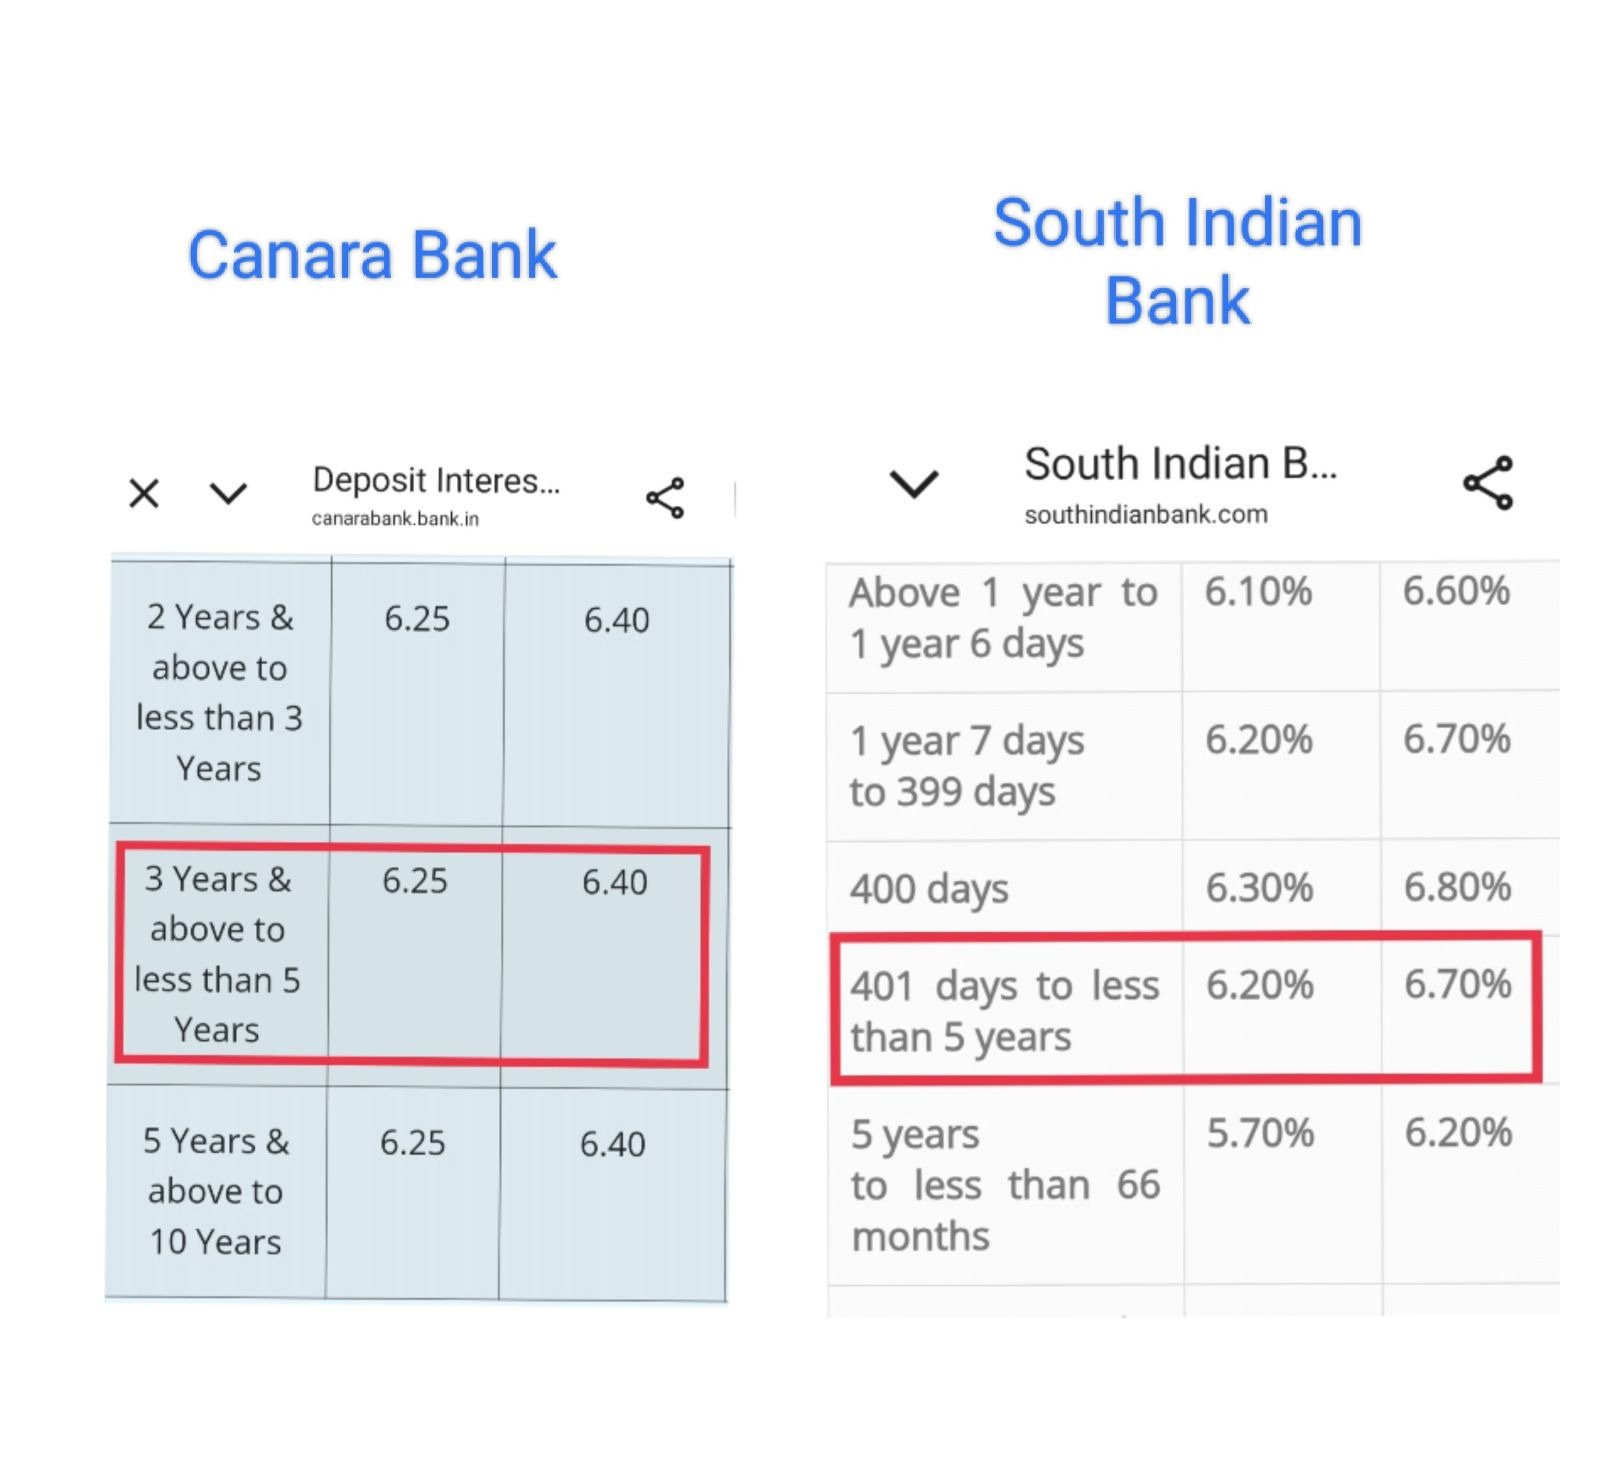
As per the image above, South Indian Bank is better in terms of yield. But the bank’s yield is calculated based on simple interest, which jacked up the number. One would have been better off sticking to Canara Bank, which showed a higher base FD rate.
Use Excel formulae
So, how do you know what’s right?
1. Check the base interest rate shown for the FD.
2. Check the compounding frequency (most are quarterly).
3. Compare only FDs with the same compounding frequency and tenure.
4. If you want to calculate the annualised yields comparable to mutual funds or bonds or want to know the effective annual rate, use the EFFECT formula in Excel:
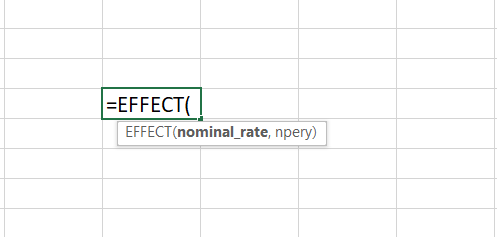
where the nominal rate is the base FD rate shown by the bank.
And ‘npery’ is compounding frequency = 4 for quarterly, 2 for half-yearly, 1 for yearly.
5. Or if you know the maturity value, use the RATE function in Excel:
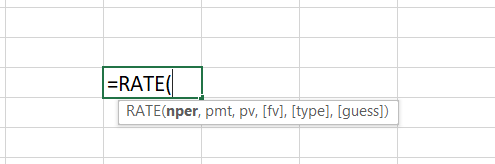
Where nper = number of years,
pmt = 0 (since there are no periodic payments in a cumulative FD),
pv = - principal
and fv = maturity value.
You can leave the rest.
The only thing you have to remember in this formula is to show the principal amount as a negative value. This is because it’s a cash outflow in the first year.

This gives you the yield or rate that you actually earn annually and comparable to others.
Final thought
True, the difference between an interest rate that is calculated based on compound interest and simple interest isn’t too significant. But this small number can become meaningful when the tenure is longer.
Nevertheless, it’s unfortunate that there are no standard rules for how banks display interest rates in a country where FDs are the backbone of household savings. The least investors deserve is clarity, not creative confusion. So, do your due diligence.
This Newsletter was written by Satya Sontanam.
Do read Why Walmart likes a loss-making Flipkart newsletter on our Side Notes by Zerodha Varsity.
For any feedback or topic suggestions, write to us at varsity@zerodha.com.
Thanks must needed one❤️
Can you make an article on SIF funds. If I have 20 lakhs, can I invest that in SIF and plan to take 1% returns every month after 2 years? I am planning to cover monthly expenses. In this case, planning to get 20K every month after 2 years. Or, should I go for doing it via SIP and then take returns after 2 years?